ThePoultrySite.com Web Site Statistics

ThePoultrySite Statistics
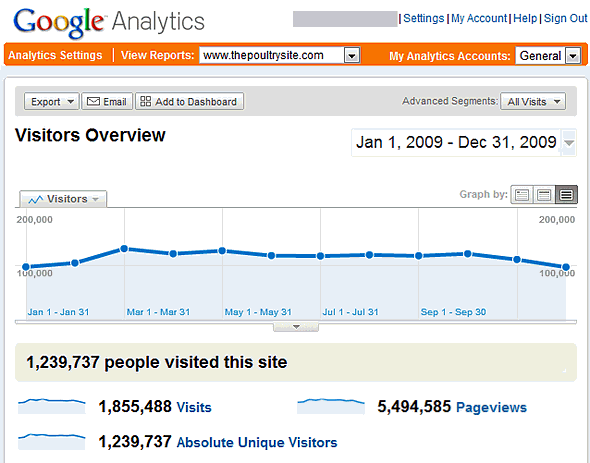
Below is a summary of the visitor statistics for ThePoultrySite.com for 2009. The key figures are as reported by the totally independent resource Google Analytics which uses a cookie based tracking system to measure traffic. This method excludes hits from robots and spiders.
Summary
From January 2009 to December 2009 ThePoultrySite received over 1.8 million visits and presented just short of 5.5 million pages. On average ThePoultrySite received 154,000 visits and presented 457,000 pages to over 103,000 visitors each month. In addition, ThePoultrySite has a very high level of industry loyalty.
Visitor Loyalty
Google Analytics reports that ThePoultrySite received a total of 1,239,737 unique visitors in 2009. The visitor loyalty figures show that 11.84% of 2009 traffic was from people who have visited the site 9 times or more. A total of 5.2% of traffic came from people who have visited the site over 50 times.
With this huge number of regular visitors coupled with thousands of pages of freely available industry information updated daily, ThePoultrySite offers the most comprehensive platform for the industry professional and advertiser alike.
Advertising on ThePoultrySite
Details on ThePoultrySite media packages and prices can be viewed here.
### ThePoultrySite.com... MORE VISITORS READING MORE PAGES ###
| TABLE 1: Visitors & Page Views for 2009 | ||||
| Month | Visits |
Page Views |
Unique Visitors | |
| December 2009 | 130,525 | 368,854 | 97,237 | |
| November 2009 | 147,181 | 414,963 | 111,449 | |
| October 2009 | 160,710 | 471,407 | 122,311 | |
| September 2009 | 156,284 | 460,792 | 118,188 | |
| August 2009 | 159,387 | 490,289 | 120,006 | |
| July 2009 | 158,345 | 484,773 | 117,852 | |
| June 2009 | 159,618 | 483,450 | 118,566 | |
| May 2009 | 177,493 | 520,718 | 127,771 | |
| April 2009 | 161,685 | 471,168 | 121,991 | |
| March 2009 | 173,087 | 504,098 | 131,646 | |
| February 2009 | 139,389 | 422,140 | 104,928 | |
| January 2009 | 131,744 | 401,520 | 97,904 | |
| TOTALS FOR 2009 | 1,855,488 | 5,494,585 | 219,662 | |
| Google "Visitor Loyalty": (9 times or more) |
||||

Visitor Breakdowns:
The following breakdowns come from three sets of data:- Registered users (own data),
- Newsletter subscribers (own data)
- Geographical data (own data plus Google Analytics).
The breakdown is as follows:
By Geographical Region (as at March 2009)
| TABLE 2: Geographic Breakdown | ||||
| Region | Newsletter | Registration | Site Visitors | Average |
| North America | 19% | 27% | 29% | 25% |
| Europe | 19% | 19% | 38% | 25% |
| Asia | 30% | 26% | 20% | 25% |
| Middle East/Africa | 25% | 22% | 5% | 17% |
| Latin America | 4% | 3% | 4% | 4% |
| Oceania/Pacific | 3% | 3% | 4% | 3% |
By Occupation (as at March 2009)
| TABLE 3: Occupational Breakdown | ||||
| Occupation | Newsletter | Registration | Average | |
| Poultry/Egg Production | 35% | 31% | 33% | |
| Veterinary/Poultry Health | 17% | 15% | 16% | |
| Breeding and Genetics | 5% | 6% | 6% | |
| Industry Consultant | 4% | 4% | 4% | |
| Feed/Nutrition | 4% | 4% | 4% | |
| Food Industry/Processing | 6% | 7% | 7% | |
| Education/Student | 6% | 7% | 6% | |
| Government/Research/Extension | 2% | 3% | 2% | |
| Other/Allied Industries | 21% | 23% | 22% | |
By Position (as at March 2009)
| TABLE 4: Position Breakdown | ||||
| Position | Newsletter | Registration | Average | |
| Management | 45% | 41% | 43% | |
| General | 26% | 32% | 29% | |
| Technical | 22% | 20% | 21% | |
| Sales | 7% | 7% | 7% | |


 © 2000 - 2021. Global Ag MediaNinguna parte de este sitio puede ser reproducida sin previa autorización.